Update: I converted the graphs into Plot.ly graphs and boy are they awesome! Here’s the gist for the Python code used to create this graph. Oh, and all of the Python coding was done with IPython. If you’re not using it, you’re crazy!
Brewing beer is a science, and scientists need accurate measurements. Enter the DS18B20 waterproof temperature sensor. Here, I take a look at exactly how accurate it is and how to apply it in the science of beer brewing. I love to make stuff. My friend Matt and I have been making beer for the last 2 years. We’ve tried a dozen or so recipes, and they all kinda call for the same procedures to be performed:
- soak your grains in hot water (~173°F) for an hour in a container (or ‘mash tun’)
- drain that (now considered ‘wort’) off of the grains
- boil the wort for an hour, adding certain hops at certain times to achieve certain flavors
- cool it down and add certain yeast
- let it sit for a few weeks
- drink
- repeat
We’ve had, what I consider to be, considerable success. Even the worst beer we’ve made is still better than (insert domestic swill brand name here). But this post isn’t about making beer, it’s about making our own tools to improve the process.
Our Needs Have Changed
As I said earlier, the past dozen or so recipes have called for the same actions. However, Matt found a recipe for Berliner Weisse, a light sour beer from Northern Germany dating back to around the 16th century. Having really enjoyed my exposure to it in the past, we decided that we’d brew it on the next brew-day. The problem was, the way the wort is prepared for a Berliner Weisse is quite different from how one would prepare, say, an ale. See, you never really boil the wort. So, what was once “Turn on the burner full blast until she’s at a full roll!” has become “How in the hell are we going to keep 10 gallons of fluid an exact temperature using just a propane burner?”. Enter the DS18B20 waterproof temperature sensor!
The Hardware
The DS18B20 (henceforth referred to as ‘the sensor’) can be purchased in a waterproof, 6’ ‘probe’ form factor, which is exactly what we needed. I planned on using this with an Arduino Mega and a TFT touch-screen display so we could have our temp readings display on a little screen mounted on our brew-cabinet. The other cool thing is that the sensor conforms to the 1-Wire protocol, which means that multiple sensors can be chained together on one data wire and only take up a single I/O port on the Arduino. So, I ordered two: one for the mash tun and another for the boil-pot. Once they came in the mail, I slapped together a quick sketch to test them out.
Analysis
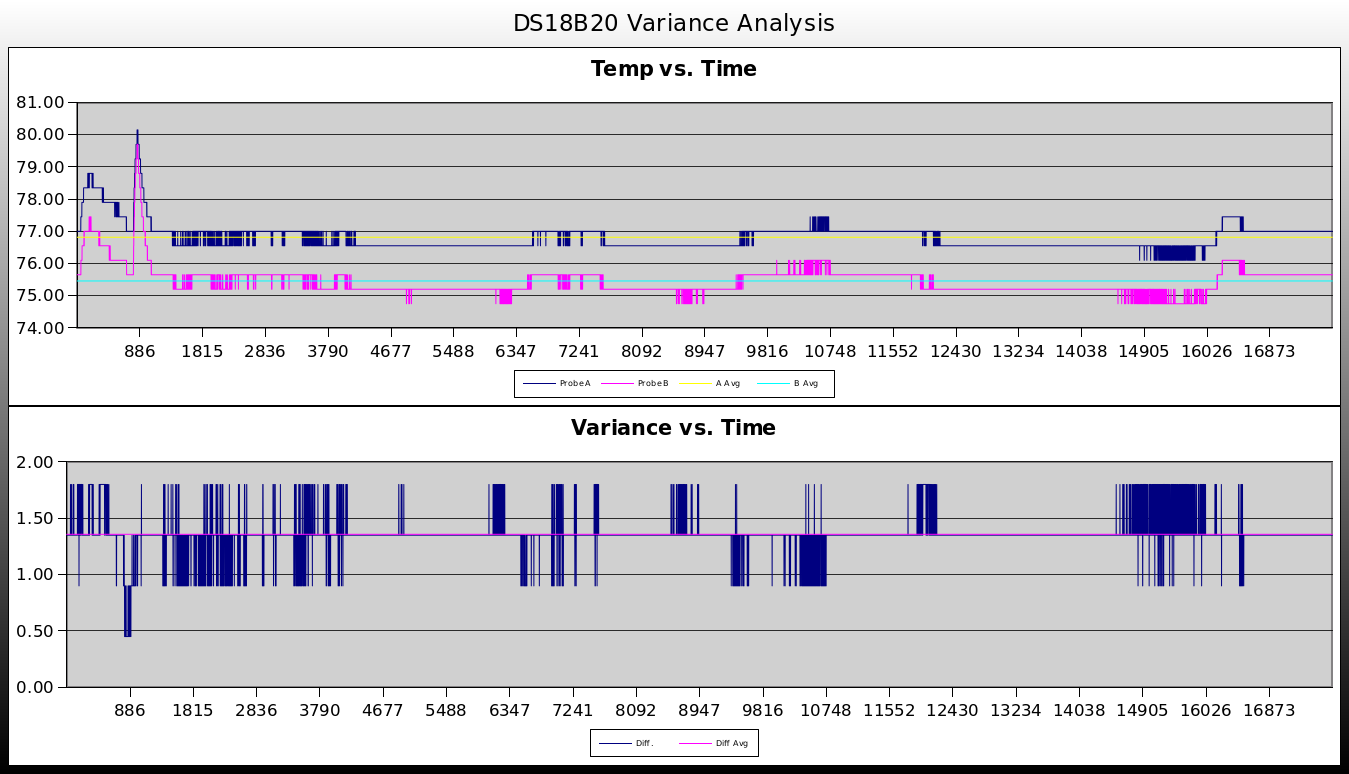
After letting them do their thing for a few minutes, I noticed that one of the two always read slightly lower than the other. I swapped their position in the circuit and got the same results. I’ll call the lower one ‘Sensor B’. Well, one of them has to be (more) right, but how to tell which one? So, I let them run for a couple of hours, logging their result to the Serial monitor. I then imported that data into LibreOffice Calc and plotted their readings over time. This is what I came up with:
 Figure 1: Ambient Temperature Readings
Update: I used this same data, but generated the first graph using Python and Plot.ly. Can you tell the difference?
As you can see from the first half of Fig. 1, the two sensors tracked each other most of the time. And my suspicions were confirmed: Sensor B is always ‘colder’ than Sensor A. The second half of Fig. 1 shows the variance b/t the two. The variance average was 1.35°F during the flat parts of the graph, and varied ±1°F from that during the ‘spikes’. Another important thing that this graph shows us is, around 886 seconds, both temperatures spike upwards and the variance plumets to less than 0.5°F. This is when I was holding the two sensor ends together so I could wrap a bread-tie around them to ensure that they were close to each other and experiencing the same temperature fluctuations as best I could. This was a clear sign that I had to reperform the test again, but under ‘real-life’ conditions…in some hot-ass liquid.

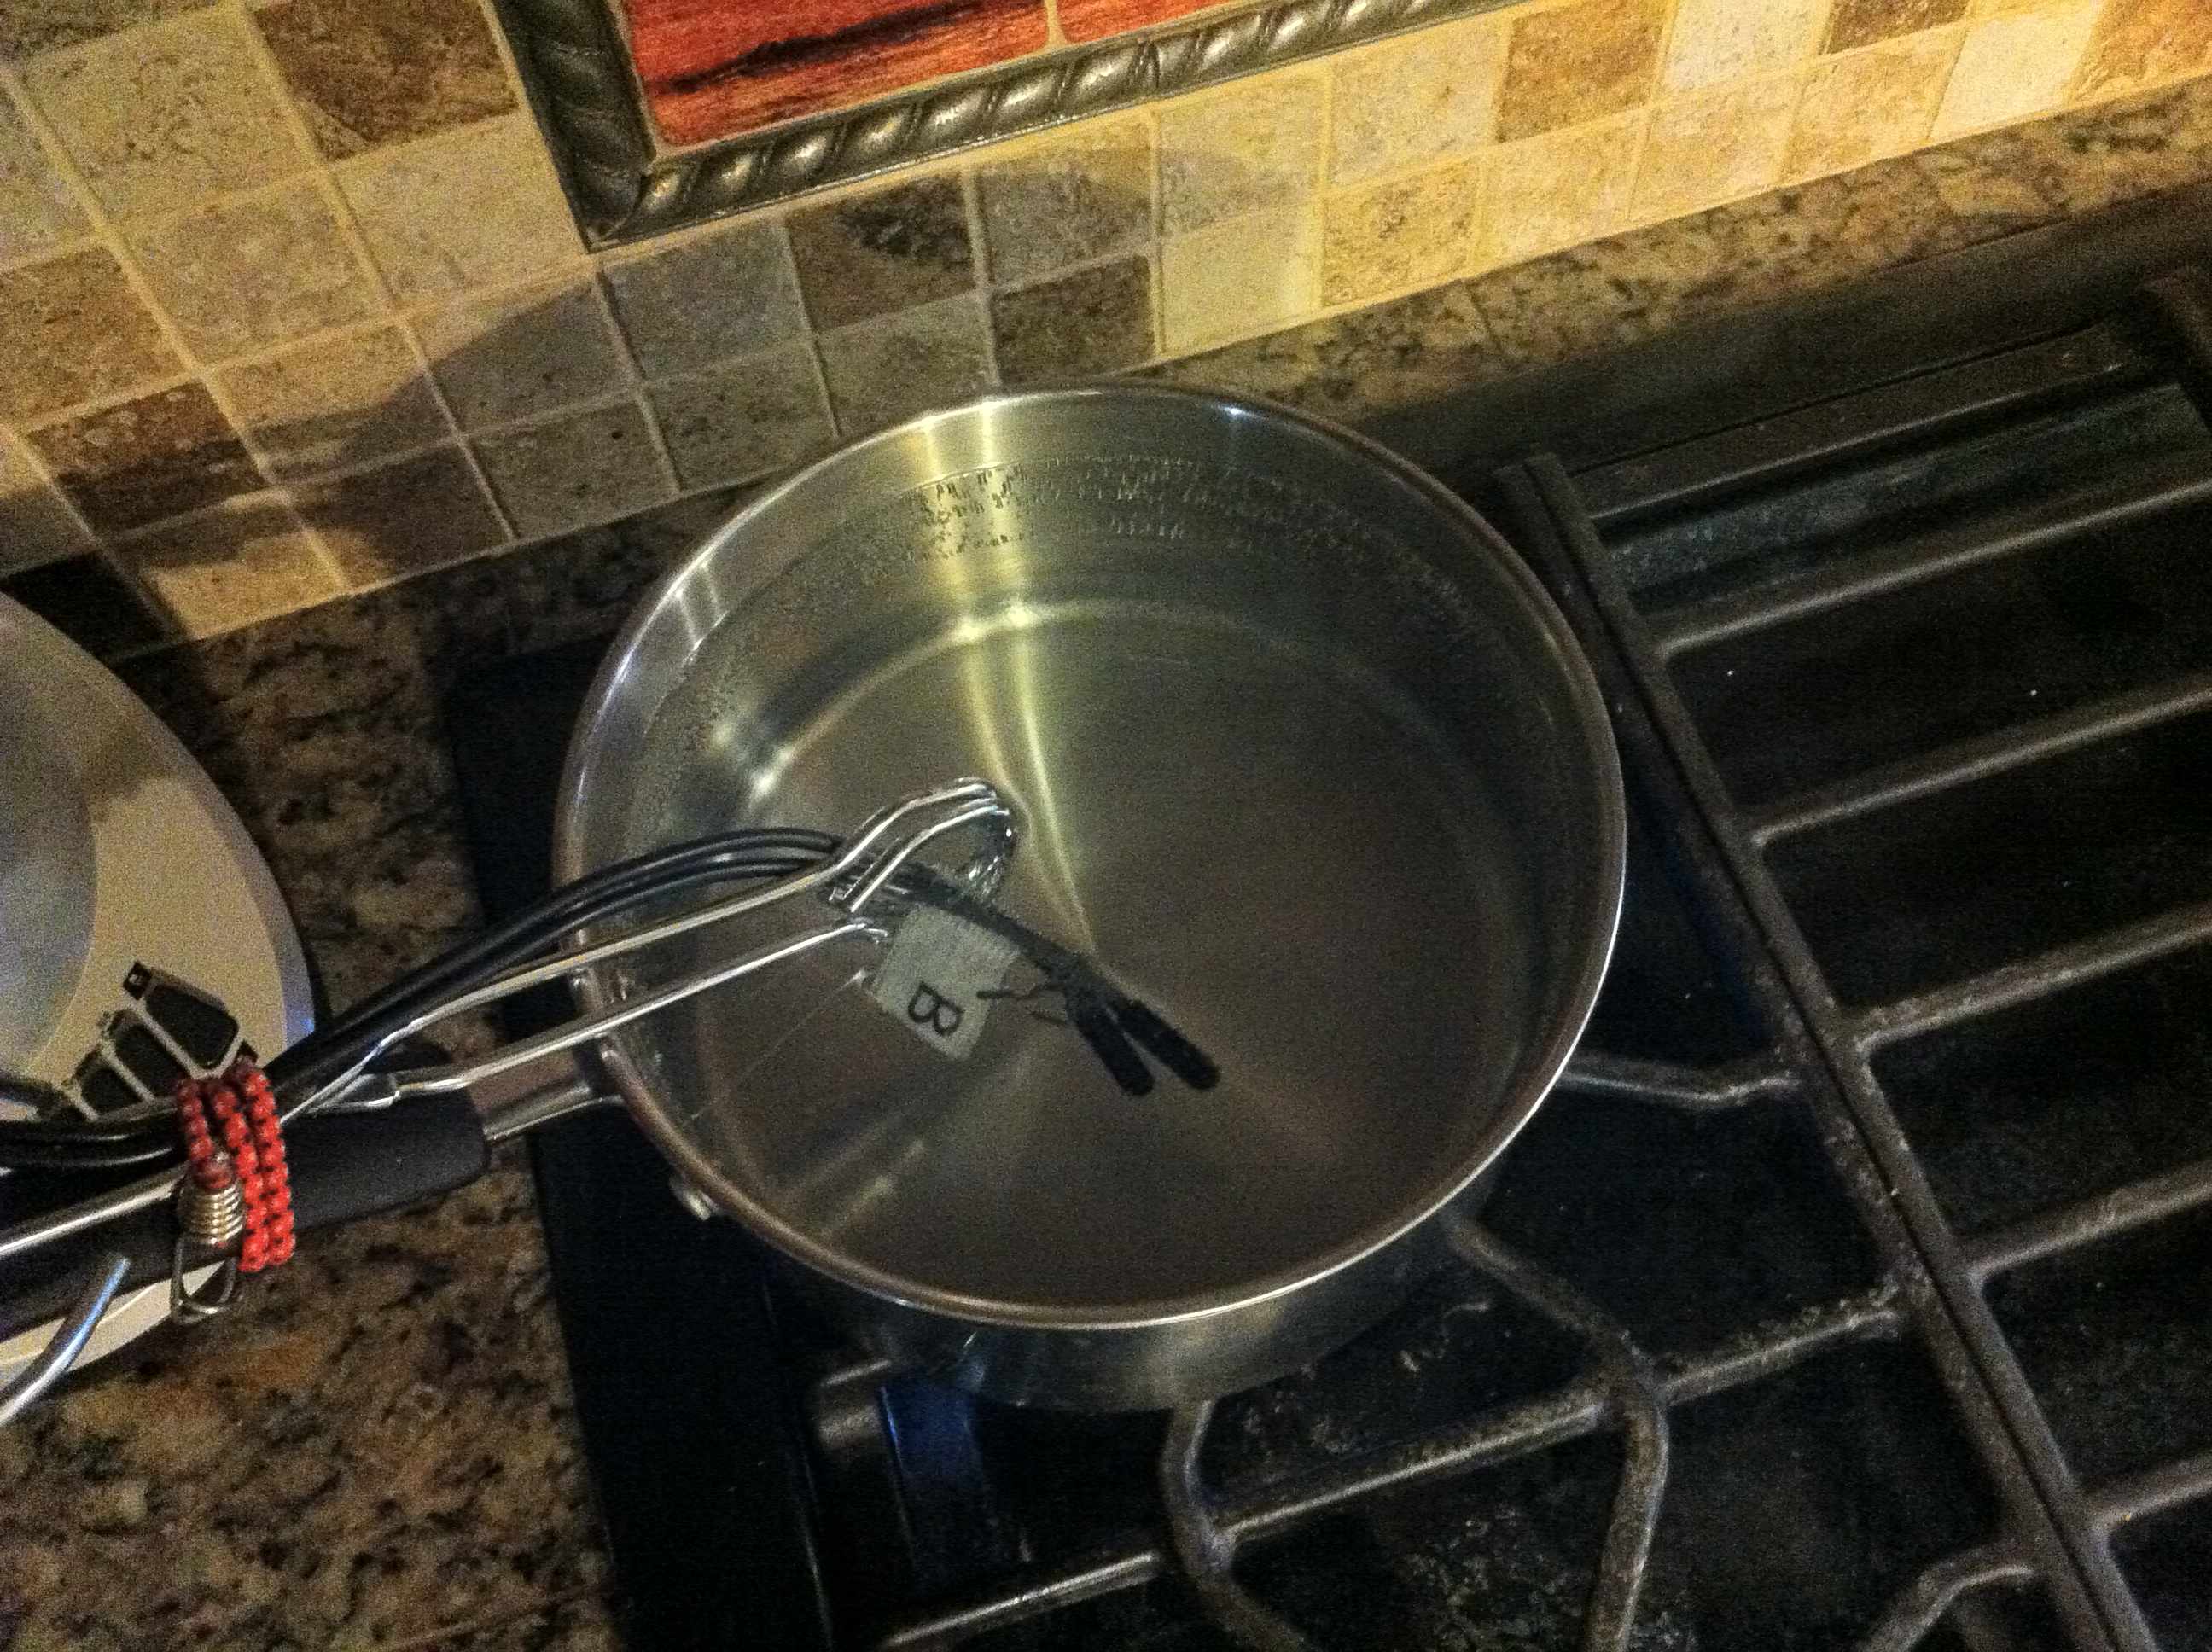
I let the sensors run as the water heated, and kept them running for about 10 minutes after the water began to boil. Here’s what I saw:
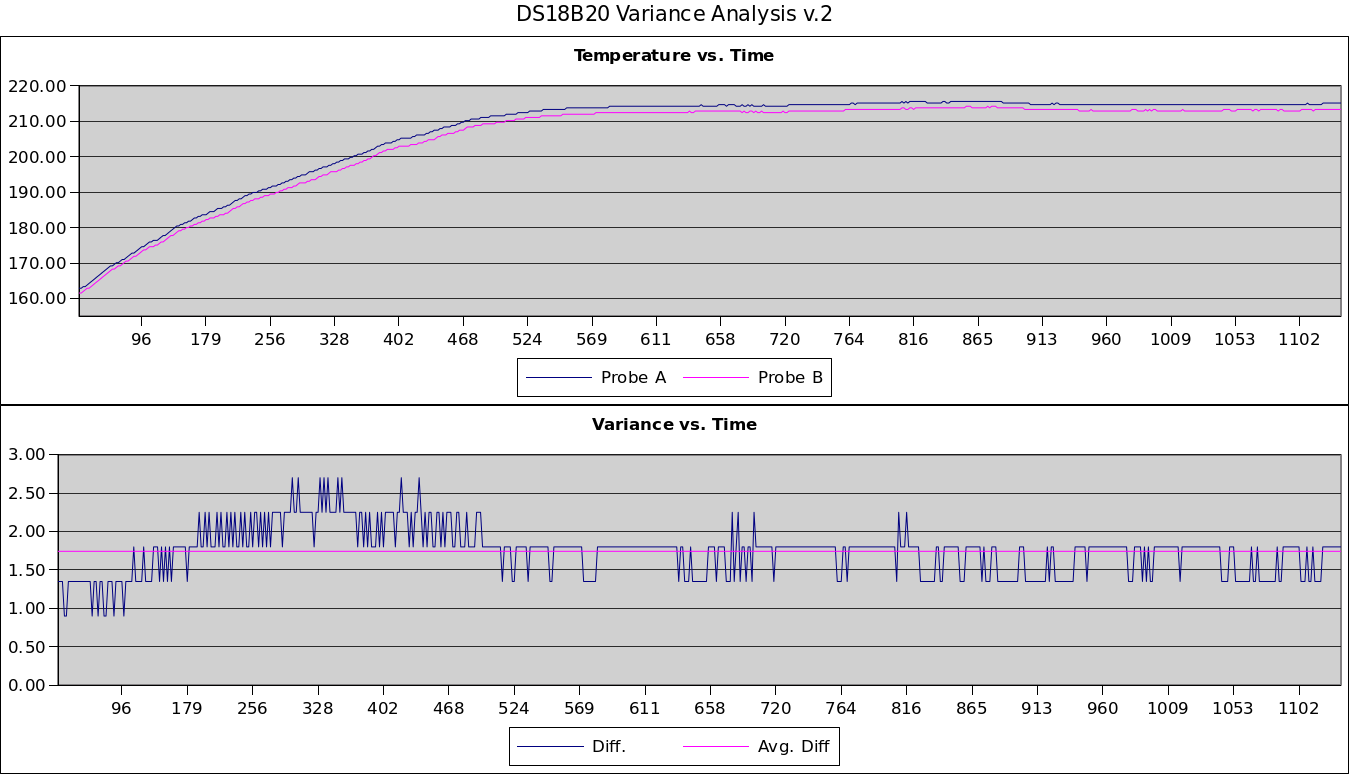
 Figure 3: Hot-Ass Liquid Temperature Readings
We can see that, under much higher temperatures, the two probes still tend to trach each other nicely. They both level off around 212°F as we’d expect. The maximum recorded for Probes A & B were 215.6°F and 214.25°F respectively. Unforunately, the average difference is now 1.74°F, an increase of 0.39°F from the last experiment’s average difference.
Conclusion
All in all, with an advertised operating range of -55°C to +125°C and an accuracy of ±0.5°C from -10°C to +85°C, its hard to say whether or not thse sensors are faulty. For the use-case for which they were purchased, 2°F variance isn’t going to ruin anything. At $9.95 a pop, I guess the moral of the story is “You get what you pay for”. And it ain’t all that bad.
